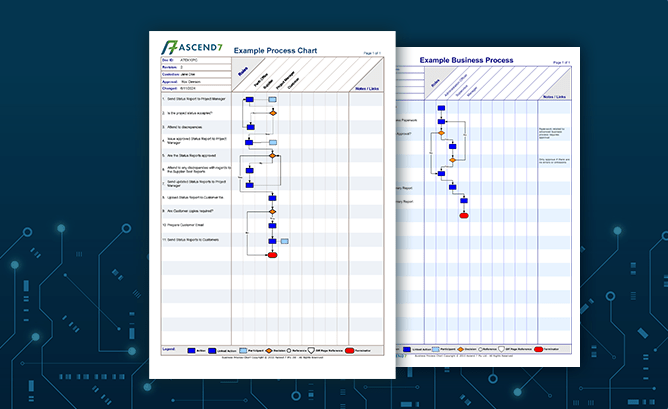
More and more organisations are recognising the importance of mapping their business processes - good reasons to do business process mapping range from capturing your current process (the AS IS processes) to documenting improvement opportunities (the TO BE processes). Business process charts can also help with compliance, risk, and training.
There's a few ways to describe or represent a business process. You might be familiar with a workflow diagram, a flowchart, or a swimlane diagram. We think a CROSS-FUNCTIONAL FLOW CHART is one of the best ways to visually capture a business process because it shows the relationship between a business process and the functional units and roles that are responsible for that process.
They show who's responsible, who's accountable, who is consulted, and who needs to be informed about activities in the business process.
Instead of just showing a linear depiction of the process, the cross-functional flow chart shows the process moving across lanes as roles are identified as responsible for different activities in the process. They also include decision points, linkage to other processes, key stakeholders, and references to supporting documentation.
The A7BPC Cross-Functional Chart
The reason we prefer to use our A7BPC cross-functional flow chart tool, is because we want the charts we develop for our clients to be useable, easy to create, easy to understand, and be a useful resource for the business going forward.
The A7BPC business process mapping tool is a simple way to define current processes and design new processes, and also easy for people to use, manage, and update. It can provide:
clarity in roles and responsibilities
a focus on cross-functional collaboratio
a detailed view of complex processes
a way to identify redundancies and gaps
improvement in accountability and transparency
versatility for multiple perspectives
Why business processes mapping is so helpful
Business process charts can help organisations clearly visualise who does what, how departments interact, and where inefficiencies lie, which makes them an ideal choice for re-engineering business processes. They provide a structured way to uncover improvements to drive efficiency, streamline workflows, and improve accountability. Plus business process mapping is a great first step to any business workflow automation project.
Business process charts:
bring clarity to processes through visualization
identify time traps, bottlenecks, hand-offs, interdependencies and other constraints
show the small details of how things happen in a process step by step


